
- Company

Managing business finances becomes increasingly complex as a company grows. Revenue, expenses, cash flow, receivables, payables, assets, and liabilities all need to be monitored regularly. While Odoo provides powerful accounting capabilities, financial teams may still need a more visual and centralized way to understand their data.
The Advanced Accounting & Dashboard module enhances the Odoo accounting experience with an interactive financial dashboard that brings important financial information together in one place.
From Profit & Loss and Balance Sheet reports to cash flow, aging analysis, financial forecasting, and key financial ratios, the dashboard helps business owners, accountants, and financial analysts understand their company's financial health faster.
Advanced Accounting & Dashboard is a financial analytics solution that provides a unified visual overview of business finances directly within Odoo.
Instead of moving between multiple accounting reports, users can access key financial information through interactive charts, summaries, and financial statements.
The dashboard helps users monitor:
This makes financial information easier to understand and supports faster, data-driven decision-making.
Traditional accounting reports contain valuable information, but manually analyzing multiple reports can be time-consuming.
A business owner may want to quickly answer questions such as:
How much revenue did we generate this month?
Are expenses increasing?
How much cash do we currently have?
What payments are overdue?
How is our profitability changing?
What could our revenue and cash position look like in the coming months?
An interactive Odoo financial dashboard brings these insights together so users can understand the numbers without spending excessive time navigating through reports.
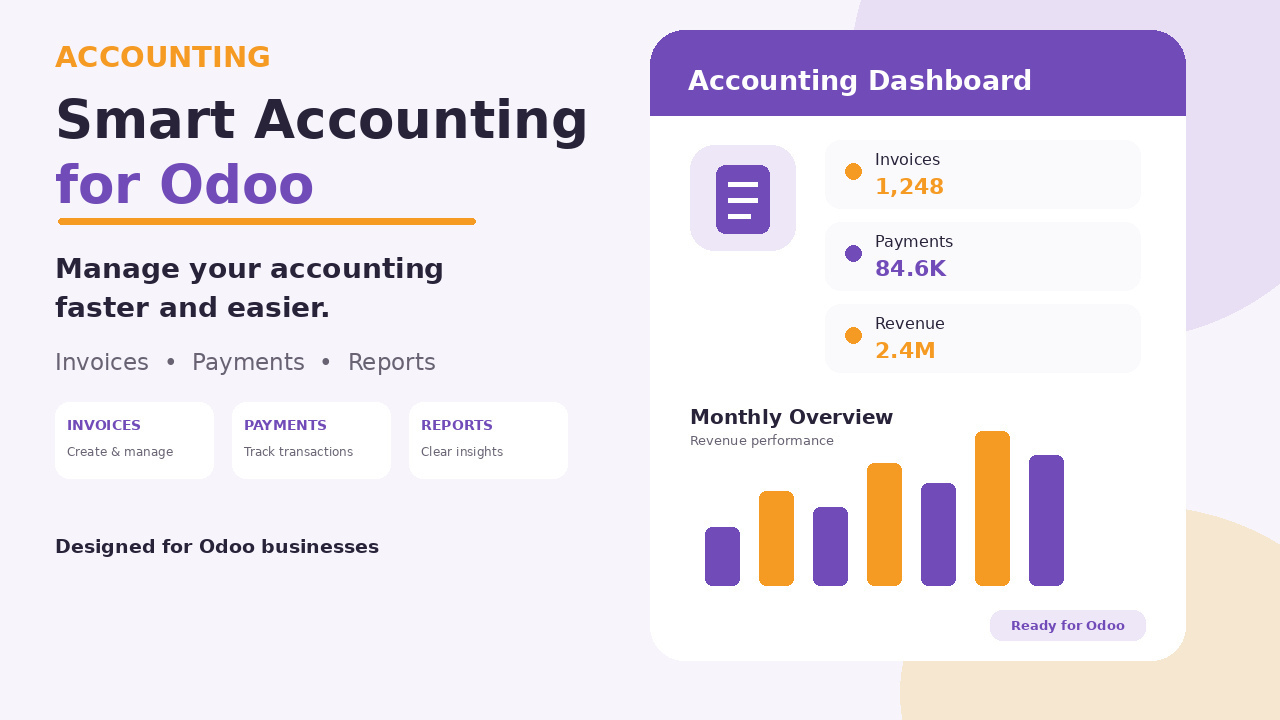
The module provides a detailed view of your company's financial performance.
Users can monitor:
The dashboard can display 12-month financial trends, helping users identify changes in revenue and expenses over time.
Why It Matters
Instead of looking only at individual accounting periods, businesses can identify financial patterns and understand how profitability is changing.
Cash flow is one of the most important indicators of business health.
The dashboard provides visibility into:
Operating Cash Flow
Money generated or used through regular business operations.
Investing Cash Flow
Cash associated with investments and asset-related activities.
Financing Cash Flow
Cash related to financing activities such as loans and capital movements.
Users can also monitor cumulative cash and live balances across bank accounts.
This gives businesses a clearer picture of their available liquidity.
The Balance Sheet provides a snapshot of a company's financial position.
The dashboard brings together:
Users can analyze financial position through visual summaries and interactive charts instead of relying solely on traditional reports.
This is particularly useful for business owners and financial controllers who need a quick overview of the organization's financial standing.
Historical financial data can provide useful insights into future business performance.
The forecasting feature allows users to compare:
Actual Revenue vs Forecast Revenue
Actual Expenses vs Forecast Expenses
Actual Cash Balance vs Forecast Cash Balance
This helps businesses identify potential financial trends and prepare for upcoming changes.
Better Forecasting Means Better Planning
Businesses can use financial forecasts to support decisions related to:
Outstanding payments can directly affect business cash flow.
The dashboard provides aging analysis for:
Aged Receivables
Monitor outstanding customer invoices and identify overdue payments.
Aged Payables
Track outstanding vendor bills and upcoming payment obligations.
Aging buckets help financial teams quickly identify where money is stuck and which payments may require attention.
The dashboard is designed to make financial information easier to understand visually.
Users can interact with charts and view:
Interactive tooltips provide additional information when users hover over chart elements.
This creates a more intuitive financial analytics experience inside Odoo.
Financial dashboards don't have to be boring.
The module includes a modern interface with support for Dark Mode and Light Mode.
Users can switch between themes directly from the dashboard, creating a more comfortable and visually appealing experience.
The dashboard helps businesses monitor critical financial indicators such as:
Working Capital
Provides insight into the company's short-term financial resources.
Current Ratio
Helps evaluate the company's ability to meet short-term obligations.
Profit Margins
Track gross and operating margins to understand business profitability.
These KPIs give decision-makers a quick way to assess overall financial performance.
The module simplifies financial analysis through a straightforward workflow.
Open the Advanced Accounting & Dashboard from your Odoo environment.
View Profit & Loss, Balance Sheet, and Cash Flow information through unified dashboard sections.
Use interactive charts and historical data to understand revenue, expenses, profitability, and cash flow trends.
Review aged receivables and payables to identify overdue customer invoices and vendor obligations.
Compare historical performance with projected revenue, expenses, and cash balances.
Use the combined financial insights to plan budgets, manage cash, and make strategic business decisions.
You may also find this helpful: WhatsApp Order Management for Manufacturers & Wholesalers
The module is designed using the latest Odoo framework and OWL architecture, supporting a responsive and interactive user experience.
Its native integration with Odoo accounting allows businesses to work with financial information without relying on a separate external dashboard.
This can help organizations maintain their accounting workflow while gaining better financial visibility.
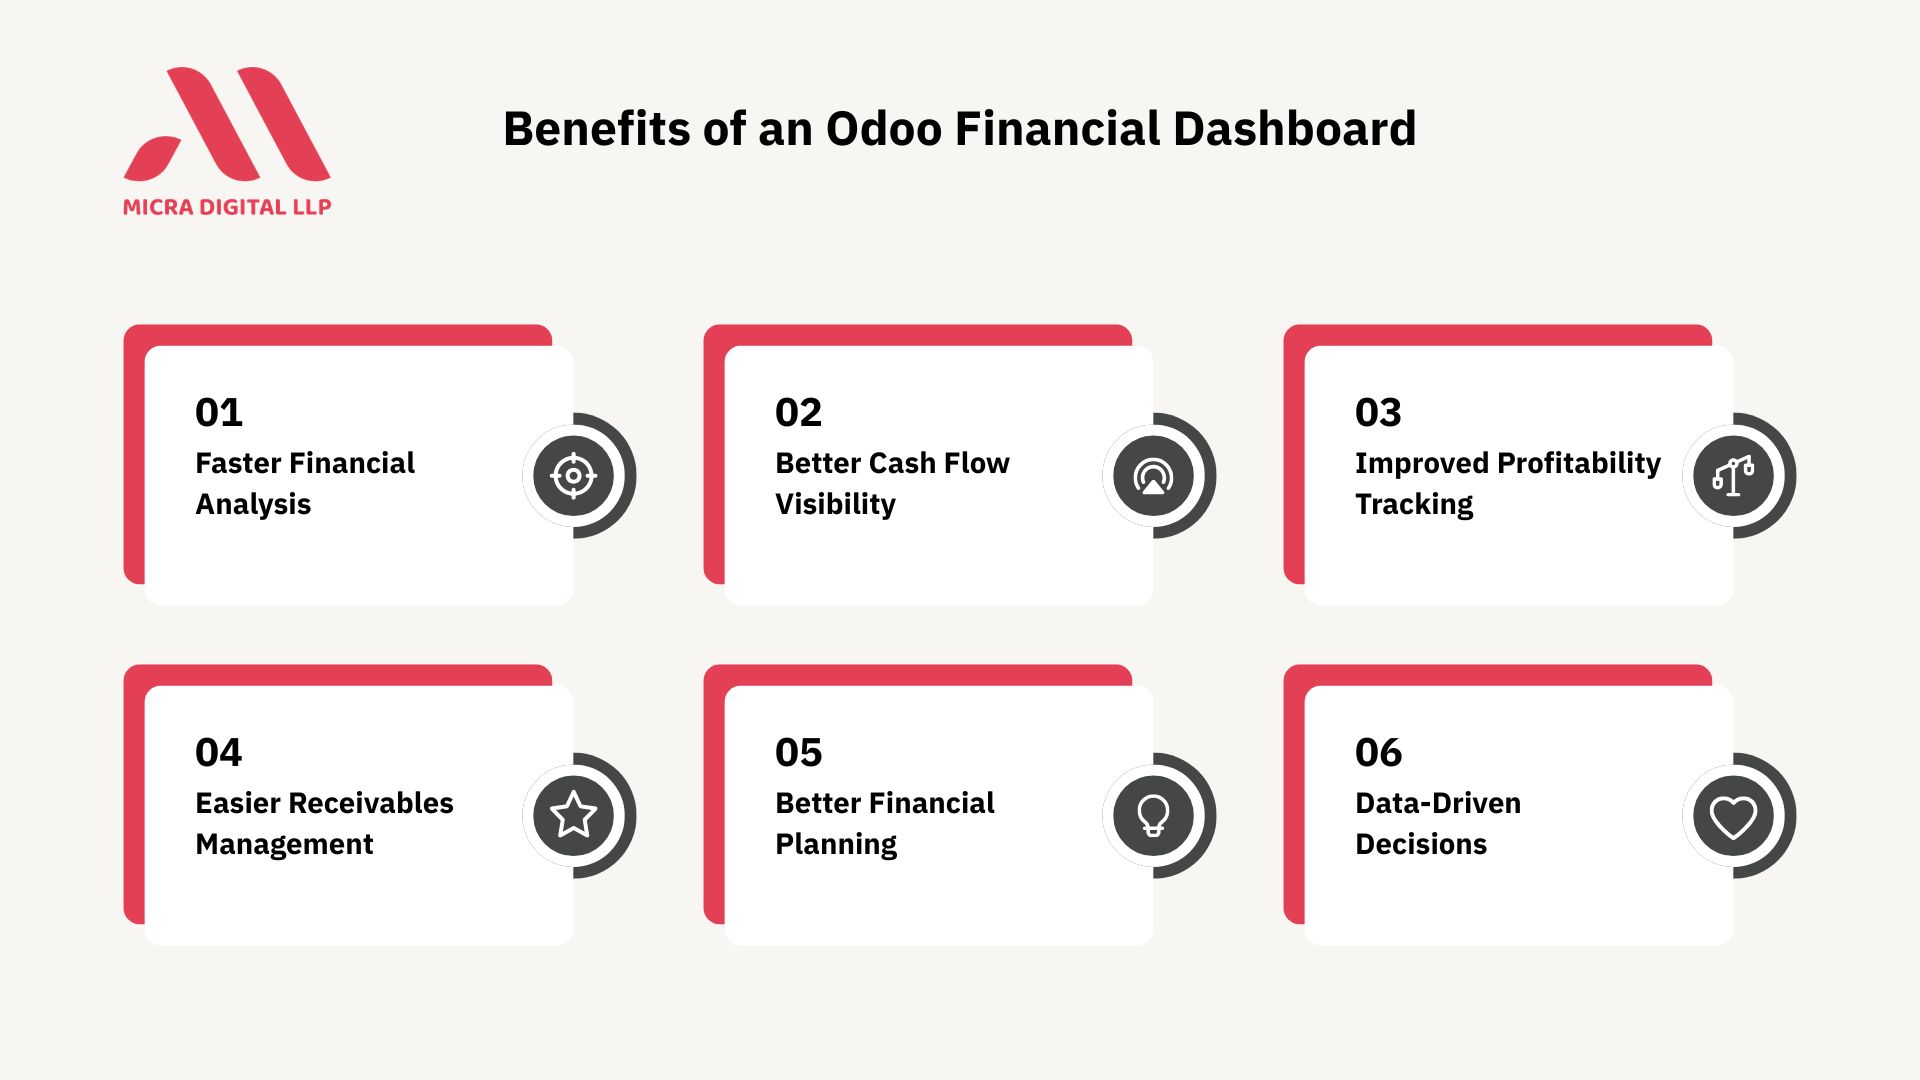
Get a high-level overview of financial performance without going through complex accounting reports.
Monitor financial statements, cash flow, receivables, payables, and profitability from one interface.
Track financial performance and identify areas that require attention.
Compare historical performance with forecasts and analyze financial trends.
Gain a centralized financial dashboard without building a separate analytics system.
Monitor revenue, expenses, cash flow, and outstanding payments while managing complex operational costs.
Track customer receivables, vendor payables, and cash flow across business operations.
Analyze profitability and monitor revenue and expense trends.
Get better financial visibility as transaction volumes and accounting requirements increase.
Provide management teams with a centralized view of financial performance.
Having accurate financial data is important, but understanding that data quickly is equally valuable.
A company can have strong sales and still face cash flow challenges. Revenue can increase while expenses grow even faster. Outstanding receivables can make a profitable business struggle with liquidity.
A comprehensive financial dashboard helps decision-makers see these patterns earlier.
With Profit & Loss, Balance Sheet, Cash Flow, Aging Reports, KPIs, and Forecasting available in one place, businesses can move from simply recording financial information to actively using it for decision-making.
Modern businesses need more than accounting records. They need financial visibility.
The Advanced Accounting & Dashboard module by Micra Digital enhances Odoo by bringing important financial information into an interactive, visual, and centralized experience.
From monitoring profitability and cash flow to analyzing receivables, payables, financial ratios, and forecasts, the dashboard gives business owners and finance teams a clearer understanding of where the business stands today and where it could be heading.
One Dashboard. Complete Financial Visibility.
With Advanced Accounting & Dashboard, turn your Odoo accounting data into clear financial insights and smarter business decisions.
An Advanced Accounting Dashboard is a visual financial analytics solution that brings important accounting information such as Profit & Loss, Balance Sheet, Cash Flow, aging reports, KPIs, and forecasts into a centralized Odoo dashboard.
The dashboard can provide insights into Profit & Loss, Balance Sheet, Cash Flow, Aged Receivables, Aged Payables, and financial forecasts, along with supporting charts and KPIs.
Yes. It provides visibility into operating, investing, and financing cash flows, along with cumulative cash and bank balances.
Yes. The forecasting functionality helps businesses compare actual and projected revenue, expenses, and cash balances to support financial planning.
The module is designed for Odoo 19 and uses the OWL framework to provide a modern, interactive financial dashboard experience.
Let Odoo take your business to the next level!
Contact us and take the next step!
Follow Our Adventures!

Ready to launch your next project?
Company
Copyright © 2020. micra.digital. All rights reserved.